DemoHalden Analytics is a fictional company on a reserved .example domain. Every source, value and number on this page is illustrative, produced by the real methodology from invented evidence.
Product analytics for software teams: event tracking, session replay and experimentation.
An estimate of how reliably the assessed digital ecosystem represents Halden Analytics: the accuracy of what people and machines encounter, weighted by how much each fact matters and how often each surface is seen. Shown as an index until calibrated.
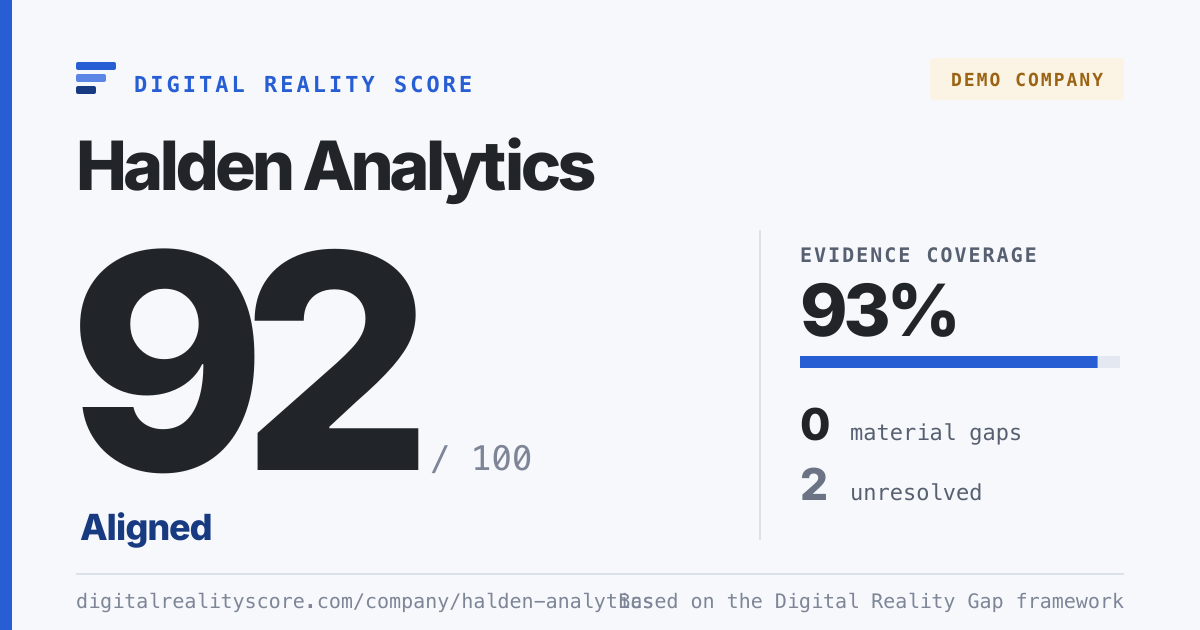
The Score measures how reliably Halden Analytics is represented. Evidence Coverage is how much of its reality could be assessed confidently.
- 0material gaps
- 2conflicting claims
- 2unresolved
14 claims · 58 observations · 16 sources · Scored 12 Sept 2026 · Methodology drs-0.2
Diagnostics
How diagnostics are measuredSix views that explain the Score. They are not averaged into it. Consistency in particular never raises a Score: sources can agree on something wrong.
- AccuracyAre important company facts represented correctly?91High confidence · 11 claims
- ConsistencyDo important sources agree?92High confidence · 11 claims
- EvidenceAre important company claims sufficiently supported?88High confidence · 11 claims
- AuthorityAre credible and authoritative sources reinforcing those claims?76High confidence · 11 claims
- DiscoverabilityCan the right company, products and information actually be found?100High confidence · 1 claim
- RepresentationDo search and AI systems describe the company correctly?89High confidence · 8 claims
The strongest findings
All 14 claims and their evidenceWhat was observed, and where. Open a finding to see every source behind it.
-
Company size lags a year behind
Halden has confirmed 501–1,000 employees, matching its LinkedIn page. Wikipedia and Crunchbase both give figures from before the 2025 hiring round, of about 450 employees.
Inspect evidenceHide evidenceClaim:
Halden Analytics → employee_range → 501–1,000 employeesConfirmed by the companyCompany size · Halden Analytics states: “501–1,000 employees” Source Representation Assessment Exposure Captured LinkedIn company pageObserved 501–1,000 employees Current Medium 24 Aug 2026 Verified company answerDeclared · reviewed 501–1,000 employees Confirmed — 3 Sept 2026 WikipediaEvidenced About 450 employees Potentially stale Medium 10 Sept 2026 CrunchbaseEvidenced 251–500 employees Potentially stale Medium 8 Sept 2026 AI answer · assistant APerceived About 500 employees Partial High 6 Sept 2026 Decision: Potential gap · Stale · P(stated value is true) 99% · representations accurate 45% · 0 independent supporting origins
-
Pricing model not independently described
Halden’s pricing page describes usage-based pricing per tracked event. No independent source checked describes the pricing model, so the claim cannot yet be assessed.
Inspect evidenceHide evidenceClaim:
Halden Analytics → pricing_model → Usage-based, per tracked eventNot yet confirmed by the companyPricing model · Halden Analytics states: “Usage-based, per tracked event” Source Representation Assessment Exposure Captured Company websiteObserved Usage-based, per tracked event Current High 25 Aug 2026 Decision: Unresolved · P(stated value is true) 78% · representations accurate 78% · 0 independent supporting origins
-
Category is consistent everywhere
Halden Analytics describes itself as a product analytics platform. Every independent source checked, all three AI assistants tested and search results use the same category. Halden has confirmed the category.
Inspect evidenceHide evidenceClaim:
Halden Analytics → primary_category → Product analytics platformConfirmed by the companyPrimary category · Halden Analytics states: “Product analytics platform” Source Representation Assessment Exposure Captured Company websiteObserved Product analytics platform Current High 11 Sept 2026 LinkedIn company pageObserved Product analytics platform Current Medium 9 Sept 2026 Verified company answerDeclared · reviewed Product analytics platform Confirmed — 6 Sept 2026 WikipediaEvidenced Product analytics company Aligned Medium 5 Sept 2026 Analyst reportEvidenced Product analytics platform Aligned Low 1 Sept 2026 CrunchbaseEvidenced Product analytics platform Aligned Medium 7 Sept 2026 Software review siteEvidenced Product analytics software Aligned Medium 3 Sept 2026 Search resultsPerceived Product analytics platform Aligned High 30 Aug 2026 AI answer · assistant APerceived Product analytics platform Aligned High 28 Aug 2026 AI answer · assistant BPerceived Product analytics platform Aligned High 26 Aug 2026 AI answer · assistant CPerceived Product analytics tool Aligned Medium 24 Aug 2026 Decision: Aligned · P(stated value is true) 100% · representations accurate 100% · 4 independent supporting origins
Your Score is a snapshot. The internet keeps changing.
SIGNAL continuously watches search, brand, mentions, evidence and AI representation, identifies important changes, and tells you what deserves action.
Claimed by Halden Analytics ✓ 2 verified people · 4 facts confirmed by the company, 1 kept private.
Work here? Join as a verified colleagueYour claim is pending Verify to start confirming facts.
Continue verificationIn review We’ll verify by hand, because it is not at @halden.example. We’ll email you.
Help resolve these claims
You are verified as . Each answer becomes evidence about Business Reality, reviewed by an analyst before it counts fully. It never sets the Score directly. Answers are private to Halden Analytics unless you choose to publish them.
Projection from your answers, using the published methodology. The Score is not recalculated live: answers apply at the next Score run. Confirming a fact can lower the Score, when the wider web disagrees with it. That is the Score working.
Benchmarks
How Halden Analytics compares with companies like it.
- Your Score
- 92
- B2B SaaS median
- 71
- Top quartile
- 84+
Evidence Coverage 93%, against a B2B SaaS median of 79%.
Illustrative cohorts. Benchmarks are published once enough companies in a cohort have been scored.
Score history
- September 2026 drs-0.29293% coverage
- July 2026 drs-0.18690% coverage
- June 2026 drs-0.18386% coverage
- April 2026 drs-0.17981% coverage
History spans methodology versions. Scores from different versions are not directly comparable; each is kept as it was published.
Scores are re-run periodically. Continuous monitoring is what PageRadar SIGNAL is for.
Share this Score
Send it to the people who own the story: brand, communications, SEO, leadership.
Want to understand what’s lowering a Score?
PageRadar applies the Digital Reality Gap framework through search strategy, Digital Reality Audits, remediation and SIGNAL. A review starts from this Score.
Digital Reality Score 92/100 and Evidence Coverage 93% were calculated on 12 Sep 2026 with methodology drs-0.2, from 58 observations across 16 sources. An automated Score cannot know every fact about a business: unknown claims stay unresolved rather than being treated as wrong. Read the methodology and the Digital Reality Gap framework it is built on.